Chart Recorders: What Are They and How Can They Help You Collect Accurate Data
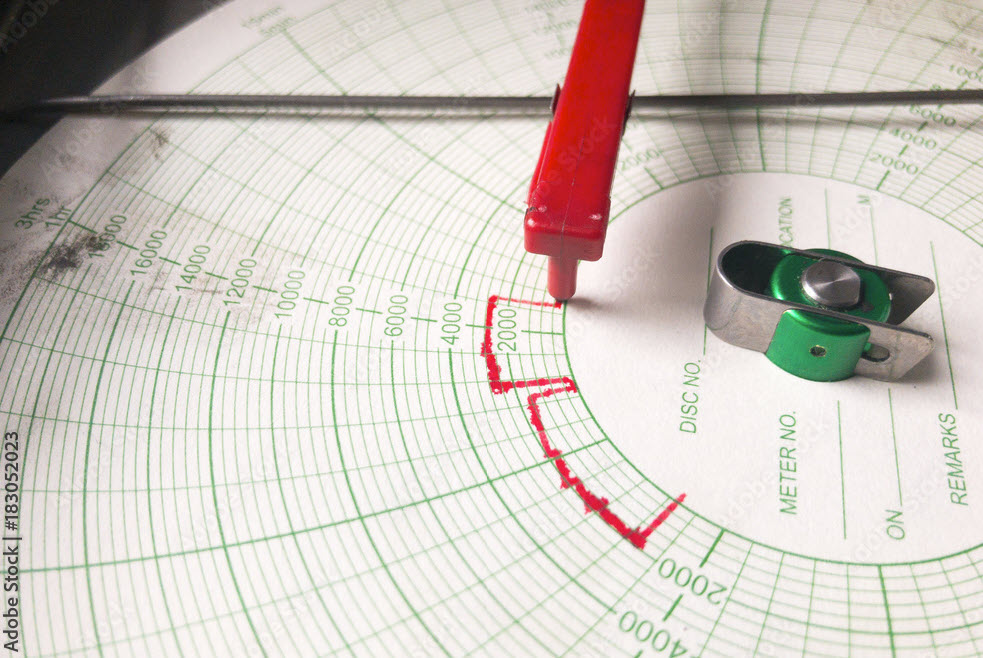
Chart Recorders: What they Are and How They Can Help You Collect Accurate Data
When it comes to data acquisition and process monitoring, chart recorders have been a reliable and effective instrument for decades. These devices excel at providing intuitive visualizations of various electrical and process signals over a specified time period. In this blog, we will explore what chart recorders are, their applications, and how they can help you collect accurate data. Additionally, we'll discuss key factors to consider when choosing a chart recorder for your specific application.
What is a Chart Recorder?
A chart recorder is an instrument used to record electrical and process signals in the form of graphical representations. Traditionally, these recorders consist of a piece of paper and a pen that moves across the paper, creating marks in response to incoming signals. The resulting graph or chart represents the recorded data over time.
Types of Chart Recorders
Chart recorders come in various configurations to suit different data recording needs:
Single Channel vs. Multichannel
Single-channel chart recorders utilize one pen to record a single input, while multichannel chart recorders employ multiple pens to chart multiple inputs in different colors.
Strip Chart vs. Circular Chart
Strip chart recorders move paper linearly to record continuous processes, whereas circular chart recorders spin round paper pads to record data within a specified, often standardized, time frame.
Applications of Chart Recorders
Chart recorders are used in a wide range of industries and settings, including:
- Manufacturing: In manufacturing environments, chart recorders track variables such as temperature, pressure, flow, PH, humidity, vibration, and movement, among others.
- Scientific and Engineering Laboratories: Chart recorders are used to transcribe data generated in diagnostics, testing, and statistical analysis, providing a visual representation of trends and patterns.
- Water Purification: For water purification equipment, chart recorders can display and record factors like temperature, flow, turbidity, PH, dissolved oxygen, etc., helping to ensure water quality.
- Tunnel Kilns: In tunnel kilns, chart recorders monitor and record temperature, providing data abnormality alarms to ensure efficient and safe operation.
- Pharmaceutical and Food Industries: Chart recorders aid in managing sterilization processes, computing F0 values based on temperature, and recording various parameters during the production process.
- Environmental Testing: Chart recorders are utilized in thermostatic chambers to display and record testing data for environmental assessments.
- Power Plants: Chart recorders acquire crucial data on turbine temperature, vibration, and abnormalities, playing a pivotal role in equipment maintenance.
Accurate Data Collection
Chart recorders help collect accurate data by providing a reliable and real-time visual representation of electrical and process signals over a specified time period. The continuous graph or chart created by the pen moving across the paper allows operators and engineers to identify trends, patterns, and anomalies easily. This visual feedback aids in detecting any sudden changes or fluctuations in the recorded data, leading to timely interventions and adjustments if necessary.
By having a physical record of the data, chart recorders offer a level of security against data loss due to power outages or system failures. Additionally, the analog nature of chart recorders makes them less susceptible to digital noise or interference, ensuring more accurate data representation. Overall, chart recorders serve as essential tools in various industries, facilitating data analysis, decision-making, and quality control processes while promoting accuracy and reliability.
Choosing the Right Chart Recorder
When selecting a chart recorder for your specific application, consider the following factors:
- Number of Inputs: Determine the number of signals you need to record simultaneously as single-channel or multichannel recorders suit different requirements.
- Signal Type: Ensure the chart recorder is compatible with the type of signals you want to measure (e.g., analog, digital, etc.).
- Recording Type: Choose between a strip chart or circular chart based on the application and data recording duration.
- Alarm Functionality: Decide if you need alarms to trigger when certain conditions are met.
- Communication Interface: Consider the style of communication interface needed to access and retrieve data.
- Environmental Conditions: Ensure the chart recorder can operate effectively in the environmental conditions where it will be used.
Chart recorders continue to be valuable tools for data acquisition and process monitoring across diverse industries. Their ability to provide visual representations of data trends over time helps operators and engineers make informed decisions. When choosing a chart recorder, make sure to consider all critical factors specific to your application. For expert guidance on finding the best chart recorder for your needs, consult reputable providers like ACI Controls.